A consistent, explainable way to price geopolitical risk — built from open macro data, live news, and a rule-bound LLM.
01 Overview
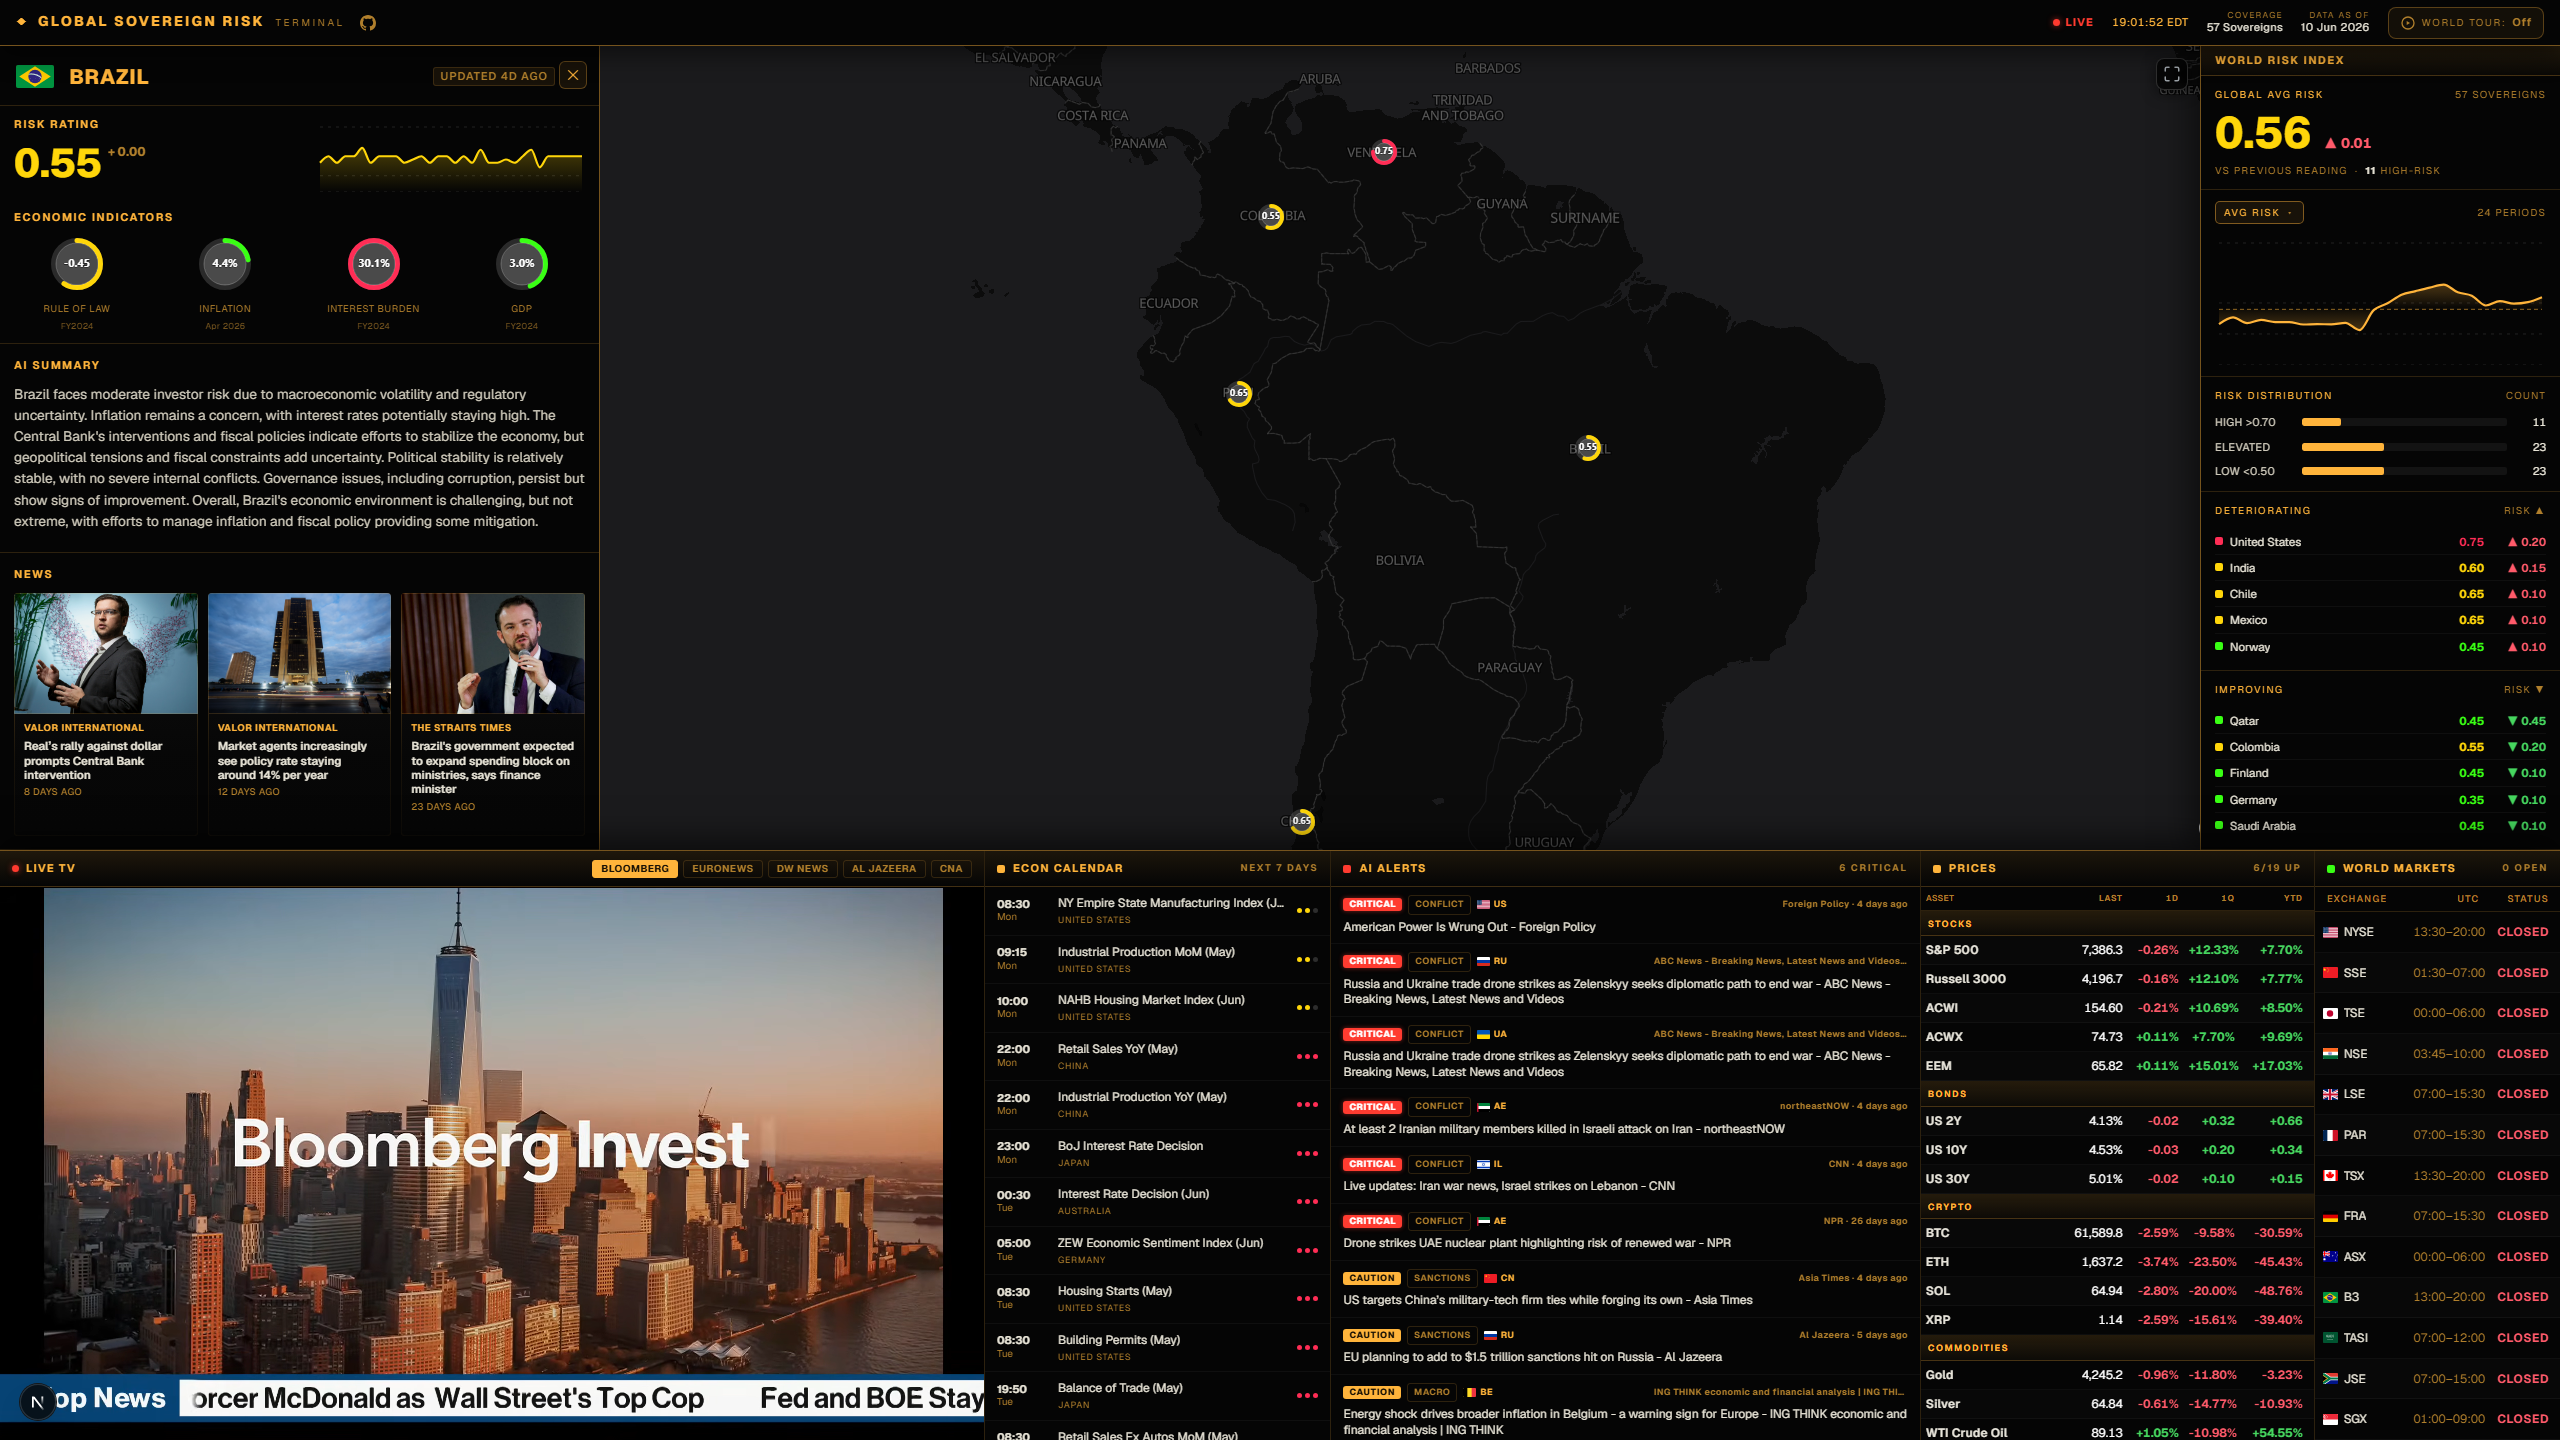
Investors face a flood of geopolitical headlines with no consistent way to price them. The dashboard fuses World Bank macro indicators — refreshed with IMF sub-annual prints and an OWID V-Dem governance index — with recent news and asks an LLM to reconcile both into a single calibrated 0–1 score plus a bullet explanation, for 56 countries (25 developed, 31 emerging), persisted in PostgreSQL and rendered on an interactive map. The map also surfaces live market Prices, an AI-ranked Alerts feed and Econ Calendar, DB-backed Live TV, and a hands-off World Tour idle mode.
02 Pipeline
Ingest
World Bank + IMF + OWID macro panels, scraped Google News headlines, and FMP market & calendar feeds.
Score
LangChain + OpenAI gpt-4o → 0–1 under hard rules and a sanctions gate.
Persist
Transactional upsert into Neon Postgres.
Render
Next.js map, served live from Postgres via cached API routes.
03 Scoring model — five sub-factors
A YAML-driven sanctions / investability gate pins un-investable jurisdictions (e.g. Russia, Iran, North Korea) to maximum risk regardless of the model output.
04 Data schema
| Table | Description |
|---|---|
| country | ISO-2 code and canonical country name. |
| indicator | Indicator definitions and units. |
| yearly_value | Annual World Bank macro values per country. |
| recent_indicator | Freshest sub-annual (IMF) values, preferred over annual. |
| risk_snapshot | 0–1 risk score and bullet summary for a given date. |
| risk_snapshot_article | Top-3 news articles tied to a snapshot. |
| news_alert | Globally AI-ranked alerts feed. |
| economic_calendar_event | Upcoming economic events with AI importance. |
| market_price | Live prices (stocks / bonds / crypto / commodities). |
| price_reference | Quarter- / year-start closes for the 1Q / YTD calc. |
| live_tv_channel | DB-backed Live TV channel list. |